


Topic 2 → Subtopic 2.9

Types of Costs

Every business encounters costs as a fundamental part of its operations. These costs reflect the resources required to produce goods and services, from raw materials and labor to rent and equipment. Understanding the different types of costs and how they behave is crucial for firms to make informed decisions about production, pricing, and profitability. Cost analysis also provides insights into how businesses adapt to changes in market conditions, competition, and scale.
This article delves into the various types of costs, their role in short-run and long-run decision-making, and how they influence strategies for growth and efficiency.
Fixed and Variable Costs
Costs can be broadly categorized into fixed and variable based on their relationship to output levels. Fixed costs are expenses that remain constant regardless of the quantity of goods or services produced. These include costs such as rent for facilities, salaries of administrative staff, and insurance premiums. Fixed costs must be paid even when production is at zero, making them a significant consideration for businesses in the early stages of operation or during periods of low demand.
Variable costs, by contrast, change directly with the level of production. They include costs for raw materials, packaging, energy, and wages for hourly workers. As production increases, variable costs rise proportionally, reflecting the additional resources needed to produce more output.
Together, fixed and variable costs constitute total costs. Dividing these total costs by the quantity of output produced gives average total cost (ATC), while marginal cost (MC) measures the cost of producing one additional unit. Understanding the interplay between these costs is vital for determining optimal pricing and production levels.
Short-Run and Long-Run Costs
The distinction between short-run and long-run costs is fundamental to understanding how businesses adjust to changes in production and market conditions. In the short run, at least one factor of production—such as capital or factory size—is fixed. During this period, firms operate within certain constraints, optimizing production by adjusting variable factors like labor and materials.
In the long run, however, all inputs become variable, allowing firms to scale up or down based on market demand and growth objectives. Long-run cost curves often reflect economies of scale, where average costs decrease as production increases. This occurs due to factors like bulk purchasing, improved operational efficiency, and specialization. However, as firms grow larger, they may encounter diseconomies of scale, where average costs rise due to inefficiencies like bureaucratic complexity or communication challenges.
Marginal and Average Costs
Marginal cost (MC) and average cost (AC) are critical metrics for understanding how costs change with production levels. Marginal cost represents the additional cost incurred from producing one more unit of output. It is a key factor in decision-making, as firms aim to produce at the level where marginal cost equals marginal revenue (MR) to maximize profit.
Average cost measures the total cost per unit of output. Comparing marginal and average costs reveals insights about economies of scale and efficiency. When marginal cost is below average cost, producing additional units lowers average cost, indicating increasing efficiency. Conversely, when marginal cost exceeds average cost, producing more increases average cost, signaling inefficiencies.
Firms analyze these metrics to determine the optimal scale of production. Marginal cost also plays a critical role in pricing strategies, particularly in competitive markets where prices often align with marginal costs.
Broader Implications
The analysis of costs extends beyond individual firms, influencing market dynamics, competition, and economic policy. Businesses with lower cost structures gain a competitive advantage, allowing them to offer lower prices or achieve higher profit margins. For instance, low-cost airlines thrive by minimizing both fixed and variable costs, enabling them to dominate price-sensitive markets.
Costs also play a critical role in regulatory decisions. Policymakers assess industry cost structures to evaluate pricing practices, ensure fair competition, and determine the feasibility of subsidies or taxes. For example, understanding the cost dynamics of renewable energy production helps governments design effective incentives to promote clean energy adoption while minimizing economic distortions.

Example:
A bakery’s fixed costs include $5,000 per month for rent, utilities, and equipment maintenance. Variable costs, such as ingredients and labor, amount to $2 per loaf of bread. If the bakery produces 2,000 loaves in a month, its total cost is $9,000, with $5,000 fixed and $4,000 variable.
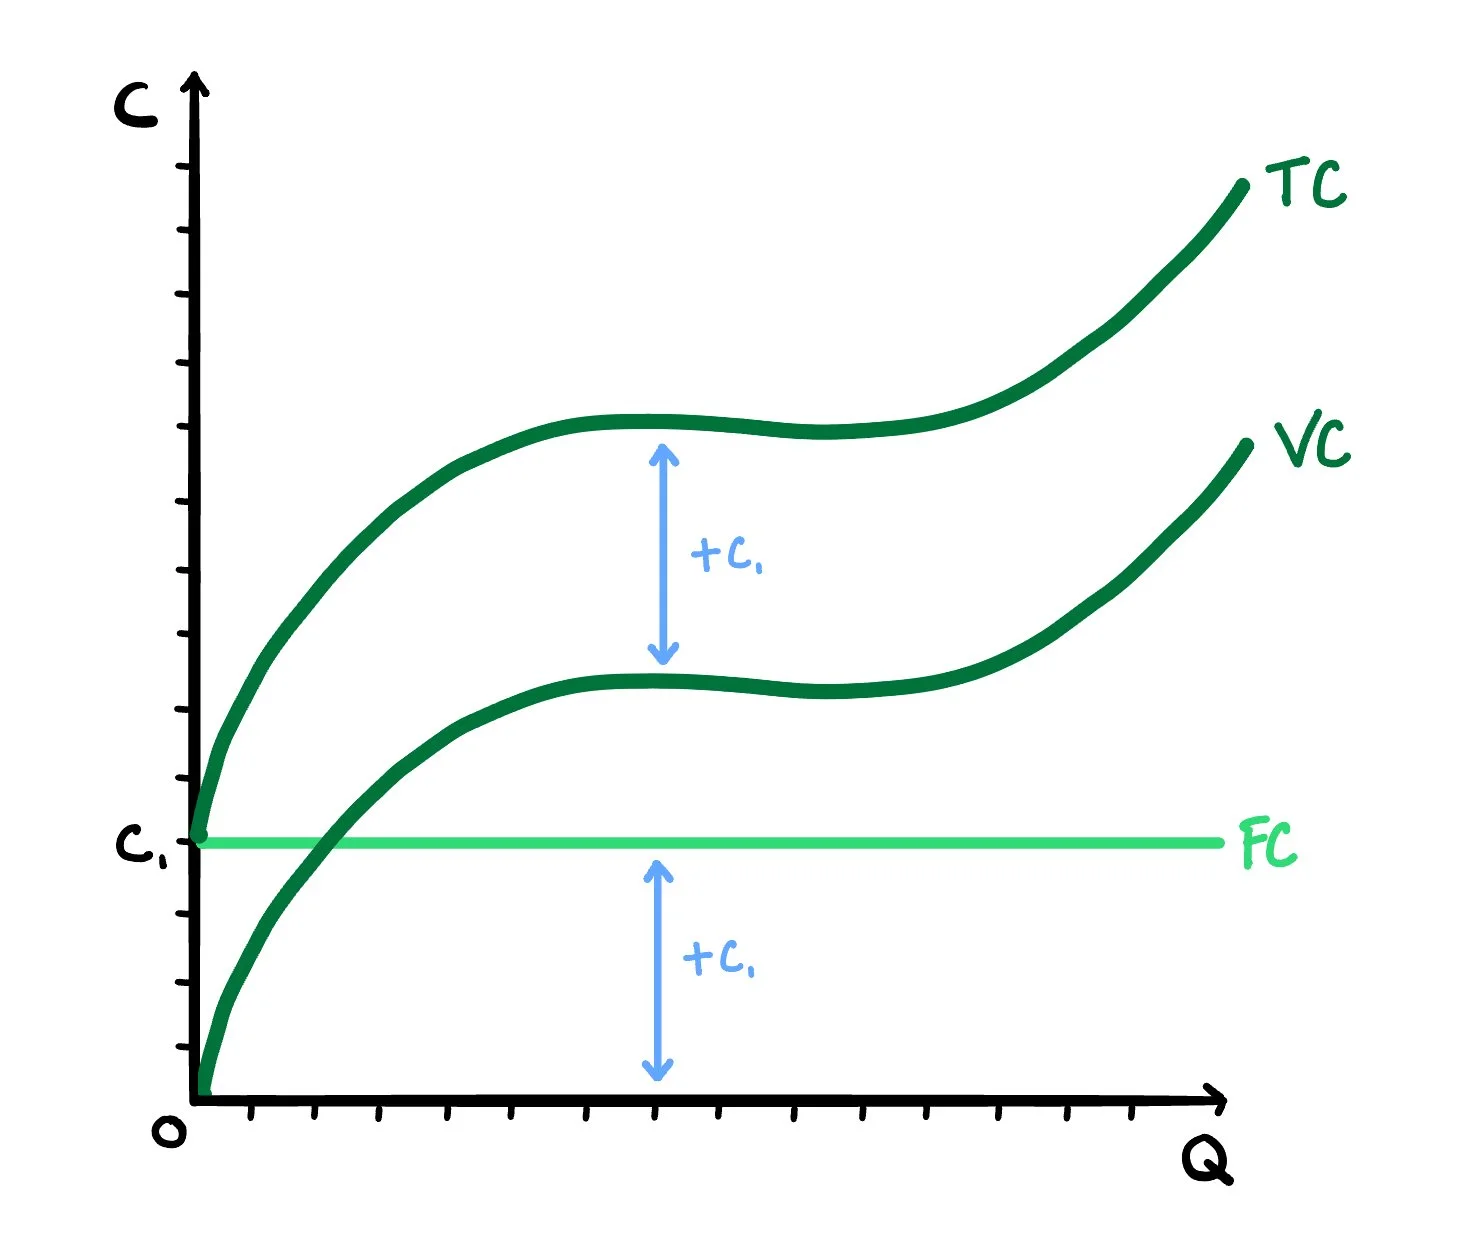
Figure 1. Fixed, Variable and Total Cost represented graphically
Where:
TC - VC = C1 = FC
-
Description text goes here

Key Graph to Remember:

Key Formula Family to Remember:

Where:
TC = Total costs
TFC = Total fixed costs
TVC = Total variable costs
AC = Average costs
Q = Quantity supplied
MC = Marginal Cost
ΔTC = Change in total cost
ΔQ = Change in Quantity Supplied (usually equals 1)
-
Description text goes here

In Summary:
Understanding the types of costs—fixed, variable, short-run, and long-run—is essential for optimizing business performance and navigating market dynamics. Cost analysis enables firms to make strategic decisions about production, pricing, and growth while offering valuable insights into market efficiency and competition. For policymakers, cost structures provide a foundation for evaluating industries and designing interventions that promote sustainable economic development.
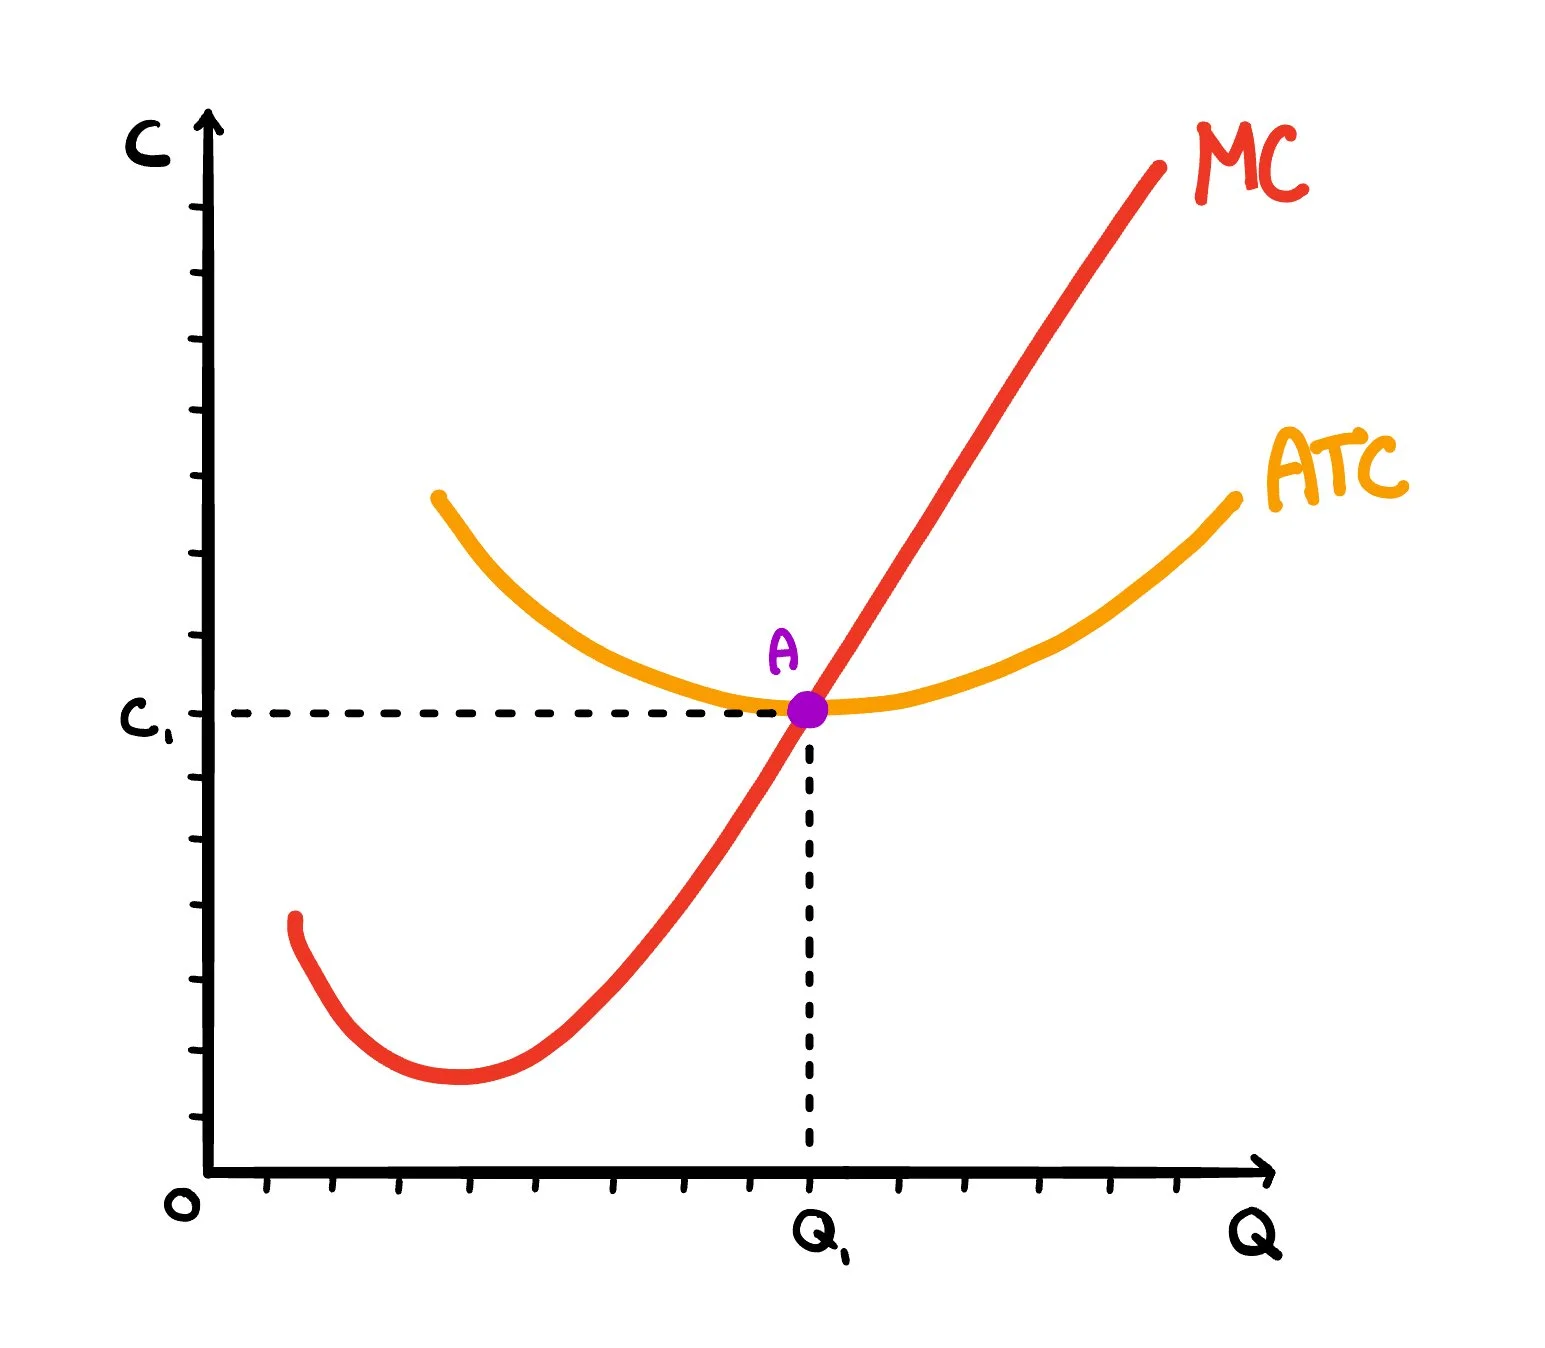
Figure 2. Marginal and Average Costs represented graphically
Where:
Point Labeled “A” = Vertex of the ATC Curve
MC curve intersects with the vertex of the ATC curve
-
Description text goes here
Key Graph to Remember:
Example:
A clothing manufacturer operates at full capacity in the short run, incurring higher marginal costs as overtime wages and rush-order materials increase. To reduce costs, the company invests in a larger facility and automated machinery in the long run, achieving economies of scale and lowering average production costs.
Example:
In the energy sector, companies investing in renewable technologies must balance high fixed costs, such as solar panel installation, with variable costs like maintenance. Governments often provide subsidies to offset these costs, encouraging market entry and long-term cost reductions through economies of scale.