


Topic 2 → Subtopic 2.6

Calculating Total Surplus

Total surplus is a cornerstone of economic analysis, measuring the overall welfare generated in a market. It is the sum of consumer surplus—the benefit consumers receive when they pay less than their willingness to pay—and producer surplus—the benefit producers gain when they sell at prices above their minimum willingness to accept. Total surplus provides a comprehensive picture of market efficiency, revealing whether resources are being allocated in a way that maximizes societal benefit.
In this article, we will focus on the mechanics of calculating total surplus, exploring its practical applications and broader implications for markets and policies.
The Mechanics of Total Surplus Calculation
Calculating total surplus involves understanding how consumer surplus and producer surplus are represented on a supply and demand graph and then determining their combined area. Let’s break this process into its key components.
Identifying the Equilibrium Price and Quantity
The first step is to determine the market equilibrium, where the quantity supplied equals the quantity demanded. This is the point where the supply and demand curves intersect. The price at this point is the equilibrium price, and the corresponding quantity is the equilibrium quantity. These values are critical for dividing the graph into regions representing consumer and producer surplus.Calculating Consumer Surplus
Consumer surplus is the area between the demand curve and the horizontal line at the equilibrium price, up to the equilibrium quantity. Mathematically, it can be calculated as the area of a triangle when the demand curve is linear: The base is the equilibrium quantity, and the height is the difference between the highest price consumers are willing to pay (the vertical intercept of the demand curve) and the equilibrium price.Calculating Producer Surplus
Producer surplus is the area between the horizontal line at the equilibrium price and the supply curve, up to the equilibrium quantity. Like consumer surplus, it is typically calculated as the area of a triangle for linear supply curves: here, the base is again the equilibrium quantity, and the height is the difference between the equilibrium price and the lowest price producers are willing to accept (the vertical intercept of the supply curve).Combine the Surpluses to Find Total Surplus
Finally, total surplus is the sum of consumer surplus and producer surplus.
Why Calculating Total Surplus Matters
Calculating total surplus provides critical insights into market efficiency. A higher total surplus indicates that resources are being allocated effectively, maximizing societal benefits. This concept is particularly relevant in perfectly competitive markets, where total surplus is naturally maximized without external distortions.
However, when policies such as taxes, subsidies, or price controls are introduced, total surplus is often reduced due to the creation of deadweight loss—an inefficiency that occurs when transactions beneficial to both consumers and producers fail to happen. By calculating total surplus before and after a policy intervention, economists can quantify its impact on market welfare and assess whether the trade-offs are justified.
For instance, a tax on a good raises its price for consumers and lowers the effective price received by producers, reducing consumer and producer surplus while generating government revenue. The lost surplus due to foregone transactions is represented graphically as deadweight loss.
Broader Implications of Total Surplus
Total surplus extends beyond individual markets to reflect the overall health of an economy. In industries where total surplus is high, markets are typically efficient, fostering innovation, investment, and growth. Conversely, low total surplus often signals inefficiencies, such as monopolistic practices, resource misallocation, or market failures, which can undermine long-term economic stability.
Policymakers use total surplus calculations to design interventions that promote equity without compromising efficiency. For example, subsidies for essential goods like food or medicine can increase consumer surplus for vulnerable populations while maintaining high levels of total surplus. Similarly, investments in infrastructure can enhance producer surplus by reducing costs and increasing productivity, benefiting both producers and consumers.

Key Graph to Remember:
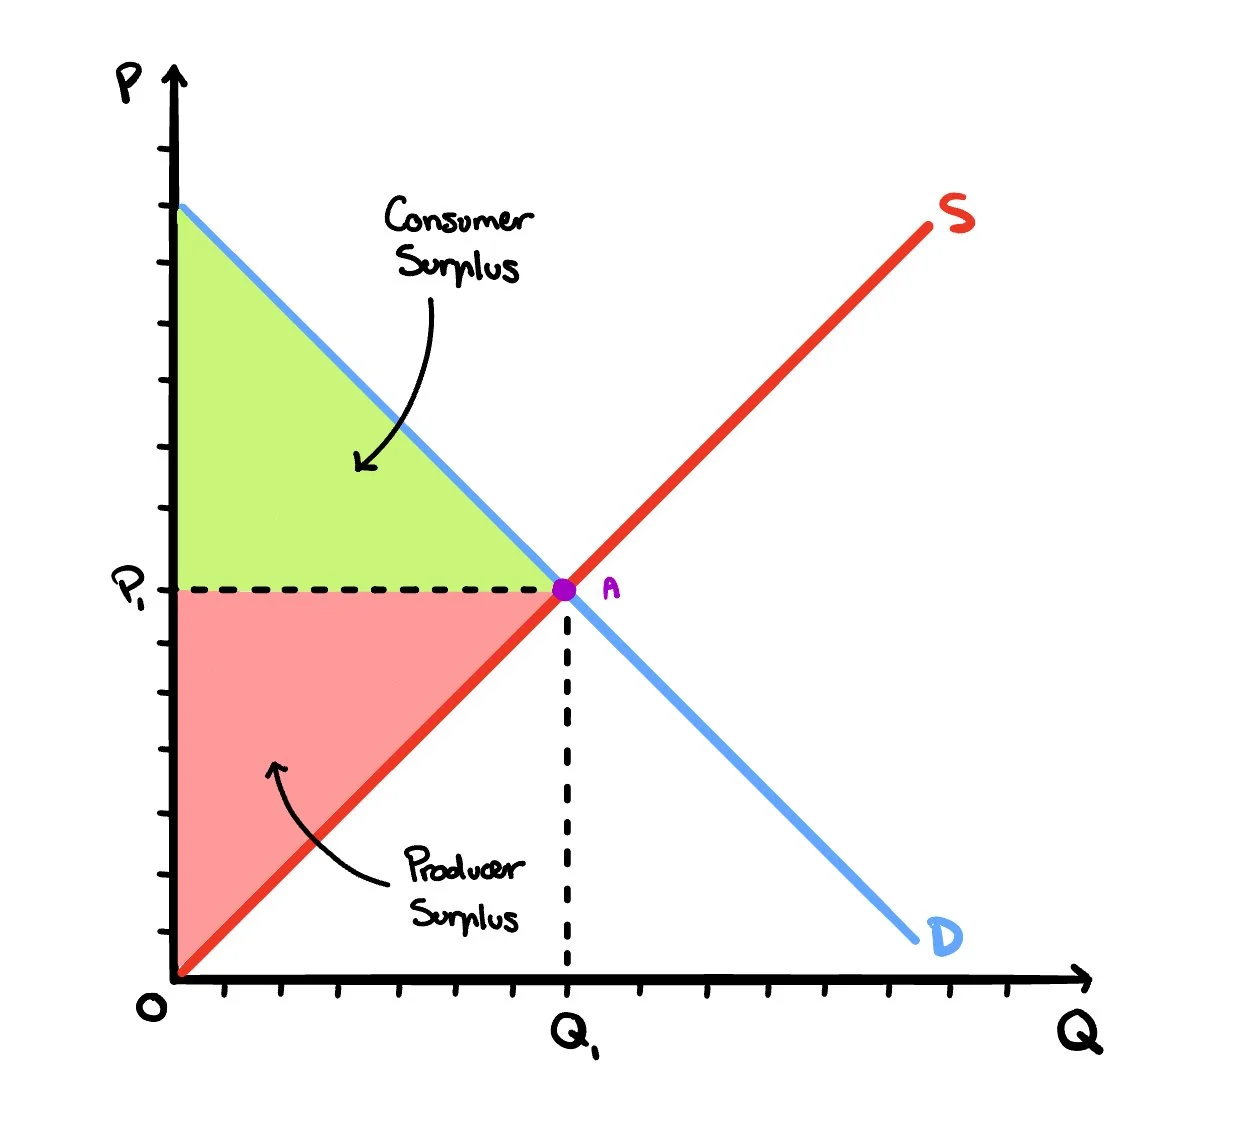
Figure 1. Total Surplus represented on a Price vs. Quantity graph
Where:
Green Area = Consumer Surplus (0.5 x (Pmax - P1) x Q1)
Red Area = Producer Surplus (0.5 x (P1 x Q1))
-
The graph above shows the total economic welfare in a competitive market, which is made up of consumer surplus and producer surplus. These two areas together represent the net gains from trade to society, and their existence explains why markets are often seen as efficient at allocating resources. At the equilibrium point A, where the supply and demand curves intersect, the market price P₁ and quantity Q₁ are set. Buyers who were willing to pay more than P₁ receive a benefit shown by the green triangle—consumer surplus. On the other side, sellers who would have accepted less than P₁ gain from selling at a higher price, forming the red triangle—producer surplus. This structure reveals the core economic “why”: when markets operate without price controls or distortions, both consumers and producers extract value, and no mutually beneficial trades are left unrealized. The larger these two combined areas, the more efficient and socially beneficial the market is considered to be.
Key points:
P₁: Market equilibrium price
Q₁: Market equilibrium quantity
Consumer surplus (green) = benefit to buyers who pay less than their maximum willingness
Producer surplus (red) = benefit to sellers who receive more than their minimum acceptable price
Total surplus = Consumer surplus + Producer surplus → measures total welfare from trade

Example:
A government imposes a $2 tax on movie tickets, raising the market price from $10 to $12. As a result, fewer tickets are sold, and the total surplus decreases by $100 due to deadweight loss. This calculation helps evaluate whether the revenue generated by the tax offsets the loss in market efficiency.

In Summary:
Calculating total surplus provides a clear measure of market efficiency and societal welfare. By combining consumer and producer surplus, it captures the overall value created in a market, offering critical insights for businesses and policymakers. Understanding the mechanics of total surplus calculation helps identify inefficiencies, evaluate the impacts of interventions, and design strategies that balance equity and efficiency. This concept lays the foundation for analyzing how government actions influence surplus and market dynamics in the next article.
Example:
A government invests in modernizing ports and transportation networks, reducing logistics costs for agricultural producers. This increases producer surplus while enabling lower market prices, boosting consumer surplus and total surplus across the economy.