


Topic 2 → Subtopic 2.2

What is Supply?

Supply is a fundamental concept in economics, representing the quantity of a good or service that producers are willing and able to offer for sale at various price levels over a specific period. Just as demand reflects the behavior of consumers, supply captures the perspective of producers, who must balance the costs of production with potential revenue. Understanding supply is crucial for analyzing market dynamics, as it determines the availability of goods and services and interacts with demand to establish market equilibrium.
In this article, we will explore the meaning of supply, the law of supply, and its broader implications for markets and production decisions.
Defining Supply and Its Components
Supply is the counterpart to demand in market analysis, focusing on the producer’s role in economic activity. It measures the quantity of a good or service that producers are both willing and able to sell at different price points. Like demand, supply depends on a variety of factors, but its primary driver is price.
The relationship between price and quantity supplied is typically positive, as higher prices incentivize producers to increase their output. This behavior is captured by the law of supply, which states that, all else being equal, an increase in price leads to an increase in the quantity supplied, while a decrease in price results in a reduction in quantity supplied.
Supply can be represented graphically by a supply curve, which slopes upward from left to right. This upward slope reflects the additional incentives producers require to increase production as prices rise, often due to higher production costs associated with scaling up output.
The Law of Supply in Action
The law of supply explains a fundamental aspect of producer behavior: higher prices provide greater incentives for production. This relationship is driven by two primary factors:
Profit Motivation: Producers are motivated to maximize profit. Higher prices increase potential revenue, making it worthwhile for producers to allocate more resources to production or expand operations.
Cost Dynamics: As production increases, producers often face rising marginal costs, such as higher labor, material, or logistical expenses. To cover these costs and justify additional output, producers require higher prices.
These principles are particularly evident in industries where scaling production is expensive or requires significant investment. For example, in the manufacturing of high-tech electronics, ramping up production often involves purchasing new machinery or expanding facilities, which necessitates higher prices to offset these costs.
Supply and Market Dynamics
Supply plays a critical role in determining market outcomes, interacting with demand to establish equilibrium prices and quantities. When supply increases due to favorable conditions such as lower production costs or technological advancements, more goods are available at every price level, shifting the supply curve outward. Conversely, when supply decreases due to factors like resource scarcity or regulatory constraints, the curve shifts inward, reducing availability.
These shifts influence not only market prices but also broader economic activity. For example, an outward shift in the supply curve often leads to lower prices, benefiting consumers and stimulating demand. An inward shift, however, can create shortages and drive prices higher, placing upward pressure on inflation and potentially reducing economic growth.
Broader Implications of Supply
The concept of supply extends beyond individual goods to reflect broader economic trends and challenges. It highlights the importance of efficiency in production, the role of innovation in reducing costs, and the significance of resource management in maintaining sustainability.
Supply also underscores the interconnected nature of markets. Changes in supply conditions in one industry often ripple through related sectors. For instance, fluctuations in the supply of crude oil affect transportation, manufacturing, and consumer goods, illustrating the wide-reaching impact of supply dynamics.

Key Graph to Remember:
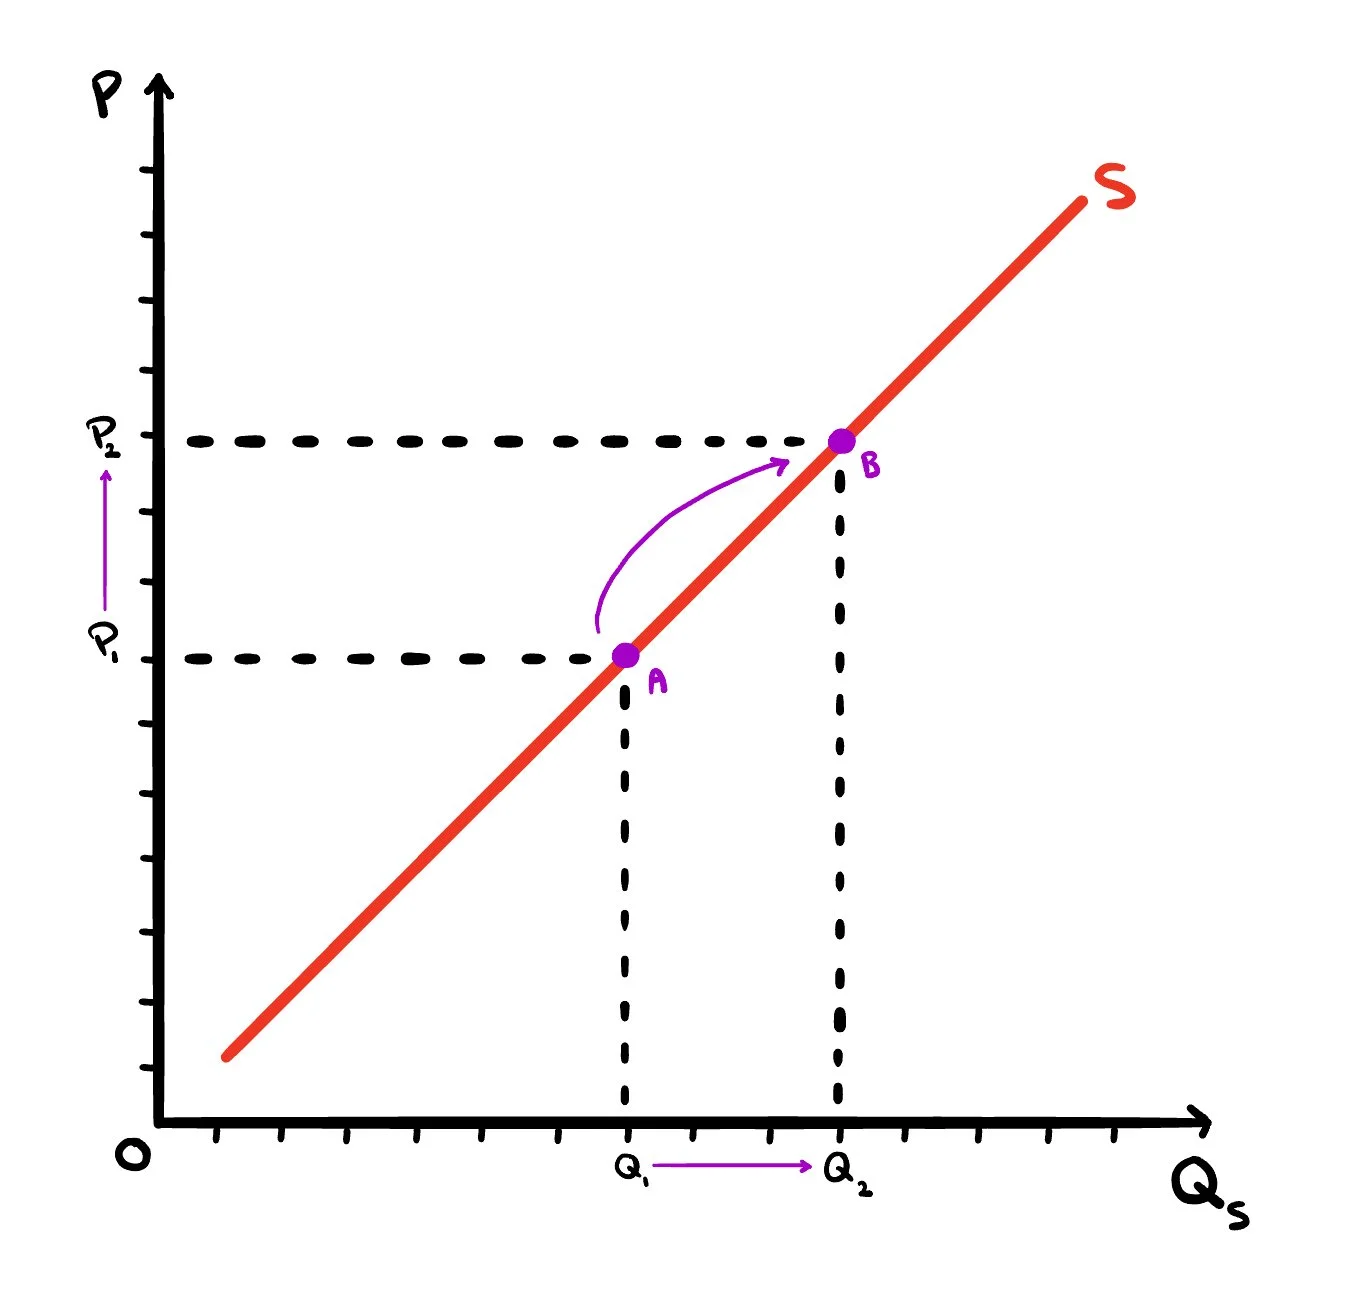
Figure 1. The Law of Supply Demonstrated as Prices on a Good Rise from P1 to P2
-
The positively sloped supply curve labeled S, seen above, shows the direct relationship between price on the vertical axis and quantity supplied on the horizontal axis. Moving from point A to point B along the curve, both the price and quantity supplied increase, illustrating the law of supply: producers are more willing and able to supply goods at higher prices because the potential for greater revenue and profit makes production more attractive. This pattern reflects the idea that higher prices can cover the rising marginal costs associated with increased output, encouraging firms to expand production. The upward movement from A to B along the same curve represents a change in quantity supplied rather than a shift of the supply curve, meaning the only factor changing here is the good’s own price, while all other non-price determinants remain constant.
Key points:
Axes: Price (vertical) vs. Quantity Supplied (horizontal)
Curve shape: Upward sloping from left to right
From A to B: Both price and quantity supplied increase
Cause: Only price changes — all other determinants remain constant
Concept: Movement along the curve = change in quantity supplied

Example:
Consider a farmer growing strawberries. If the market price of strawberries rises from $2 to $4 per pound, the farmer may decide to allocate more land and labor to strawberry cultivation, increasing the quantity supplied. Conversely, if the price drops to $1 per pound, the farmer might reduce production or shift resources to other crops that offer higher returns.

In Summary:
Supply represents the willingness and ability of producers to offer goods and services for sale at various price levels. Governed by the law of supply, it reflects the positive relationship between price and quantity supplied, shaped by factors such as profit incentives and production costs. Supply’s interaction with demand determines market prices and quantities, making it a crucial component of economic analysis. Understanding supply provides valuable insights into production dynamics, market trends, and the broader forces shaping economic activity.
Example:
Renewable energy technologies, such as solar panels and wind turbines, have experienced outward shifts in supply curves due to advancements in production techniques and economies of scale. These shifts have made renewable energy more affordable and accessible, accelerating the transition to sustainable energy systems.