


Topic 2 → Subtopic 2.2

Movement Along vs. Shift in the Supply Curve

In the study of supply, distinguishing between a movement along the supply curve and a shift of the supply curve is vital. These concepts, while related, describe fundamentally different phenomena. Movements along the supply curve occur as a direct result of changes in the price of a good, reflecting adjustments in quantity supplied within the current framework. Shifts in the supply curve, by contrast, are driven by external factors that alter the supply at all price levels, creating a new curve entirely. Understanding these differences allows for a deeper analysis of market behavior and production dynamics.
Movements Along the Supply Curve
A movement along the supply curve occurs when a change in the price of a good leads to a corresponding change in the quantity supplied, while all other factors remain constant. This behavior reflects the law of supply, which states that producers are more willing and able to supply greater quantities of a good at higher prices and less willing at lower prices. Graphically, movements along the supply curve involve shifts between points on the same curve.
Shifts in the Supply Curve
Shifts in the supply curve occur when factors other than the price of the good influence the quantity supplied at every price level. These external factors may include changes in input costs, technological advancements, government policies, or natural events. Shifts result in the creation of a new supply curve, either outward (indicating increased supply) or inward (indicating decreased supply).
An outward shift in the supply curve often occurs when production becomes more efficient or less costly. For instance, technological advancements, such as automation, can significantly enhance output by reducing labor and material expenses. Conversely, an inward shift might result from rising input costs or disruptions in production. For example, a sudden spike in energy costs could lead producers to cut back on output, decreasing supply at all price levels.
Distinguishing Movements and Shifts
The primary distinction between movements along the supply curve and shifts of the curve lies in their causes and effects. Movements are driven solely by changes in the price of the good and involve adjustments along the existing supply curve. In contrast, shifts result from external factors unrelated to the good’s price, fundamentally altering the supply relationship and creating a new curve.
Graphically, movements along the curve involve transitions between points on the same curve, while shifts result in the entire curve moving outward or inward. For example, a temporary increase in the price of wheat would lead to a movement along the supply curve as farmers expand production to capture higher profits. However, the introduction of government subsidies for wheat farming would shift the entire supply curve outward, reflecting increased supply at all price levels.
Implications for Market Dynamics
Understanding the distinction between movements along and shifts in the supply curve is critical for analyzing market behavior. Movements along the curve provide insights into how producers adjust output in response to immediate price changes, which are typically short-term reactions. Shifts in the supply curve, on the other hand, signal deeper structural changes that can reshape entire industries and influence long-term market trends.
For businesses, recognizing whether supply changes are price-driven or externally influenced enables more effective planning and strategy development. Policymakers also rely on this understanding to design interventions, such as subsidies or taxes, to address supply constraints or promote growth. For instance, an inward shift in the supply of semiconductors during a global shortage necessitated government and industry responses to restore balance, while outward shifts in renewable energy supply have encouraged broader adoption and economic benefits.
Why These Concepts Matter
The distinction between movements along and shifts in the supply curve provides essential insights into market dynamics. Movements reflect immediate adjustments to price changes, offering a snapshot of short-term producer behavior. Shifts, by contrast, indicate broader changes in supply conditions that require long-term adaptation and strategic responses.
For businesses, understanding these concepts is vital for decision-making, whether responding to temporary price changes or planning for long-term shifts caused by technological advancements or policy changes. Policymakers, too, use these distinctions to address challenges in supply and ensure market stability. By grasping these nuances, stakeholders can navigate complex markets with greater precision, adapting effectively to both short-term fluctuations and long-term transformations.

Key Graph to Remember:
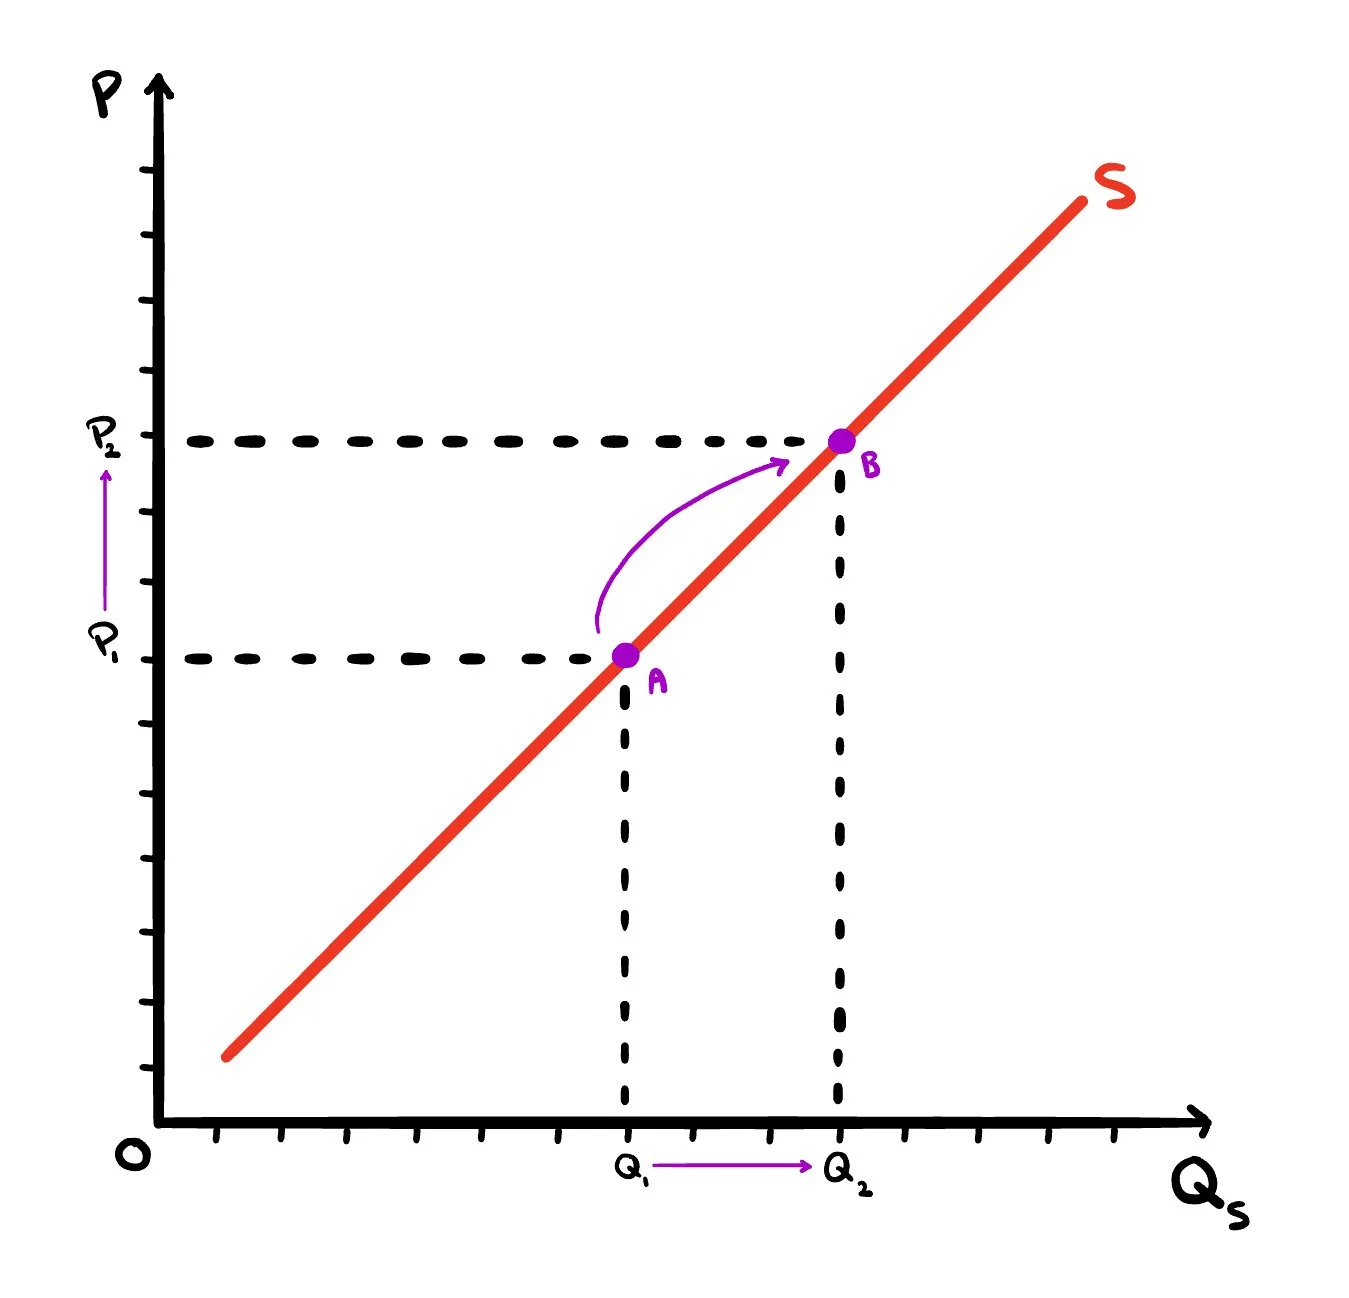
Figure 1. The Law of Supply Demonstrated as Prices on a Good Rise from P1 to P2
-
The positively sloped supply curve labeled S, seen above, shows the direct relationship between price on the vertical axis and quantity supplied on the horizontal axis. Moving from point A to point B along the curve, both the price and quantity supplied increase, illustrating the law of supply: producers are more willing and able to supply goods at higher prices because the potential for greater revenue and profit makes production more attractive. This pattern reflects the idea that higher prices can cover the rising marginal costs associated with increased output, encouraging firms to expand production. The upward movement from A to B along the same curve represents a change in quantity supplied rather than a shift of the supply curve, meaning the only factor changing here is the good’s own price, while all other non-price determinants remain constant.
Key points:
Axes: Price (vertical) vs. Quantity Supplied (horizontal)
Curve shape: Upward sloping from left to right
From A to B: Both price and quantity supplied increase
Cause: Only price changes — all other determinants remain constant
Concept: Movement along the curve = change in quantity supplied

Example:
A bakery selling artisan bread observes a price increase from $5 to $7 per loaf. In response, the bakery increases its output to take advantage of the higher prices, representing an upward movement along the supply curve. If prices drop to $3, the bakery may scale back production, moving downward along the curve.

Key Graph to Remember:
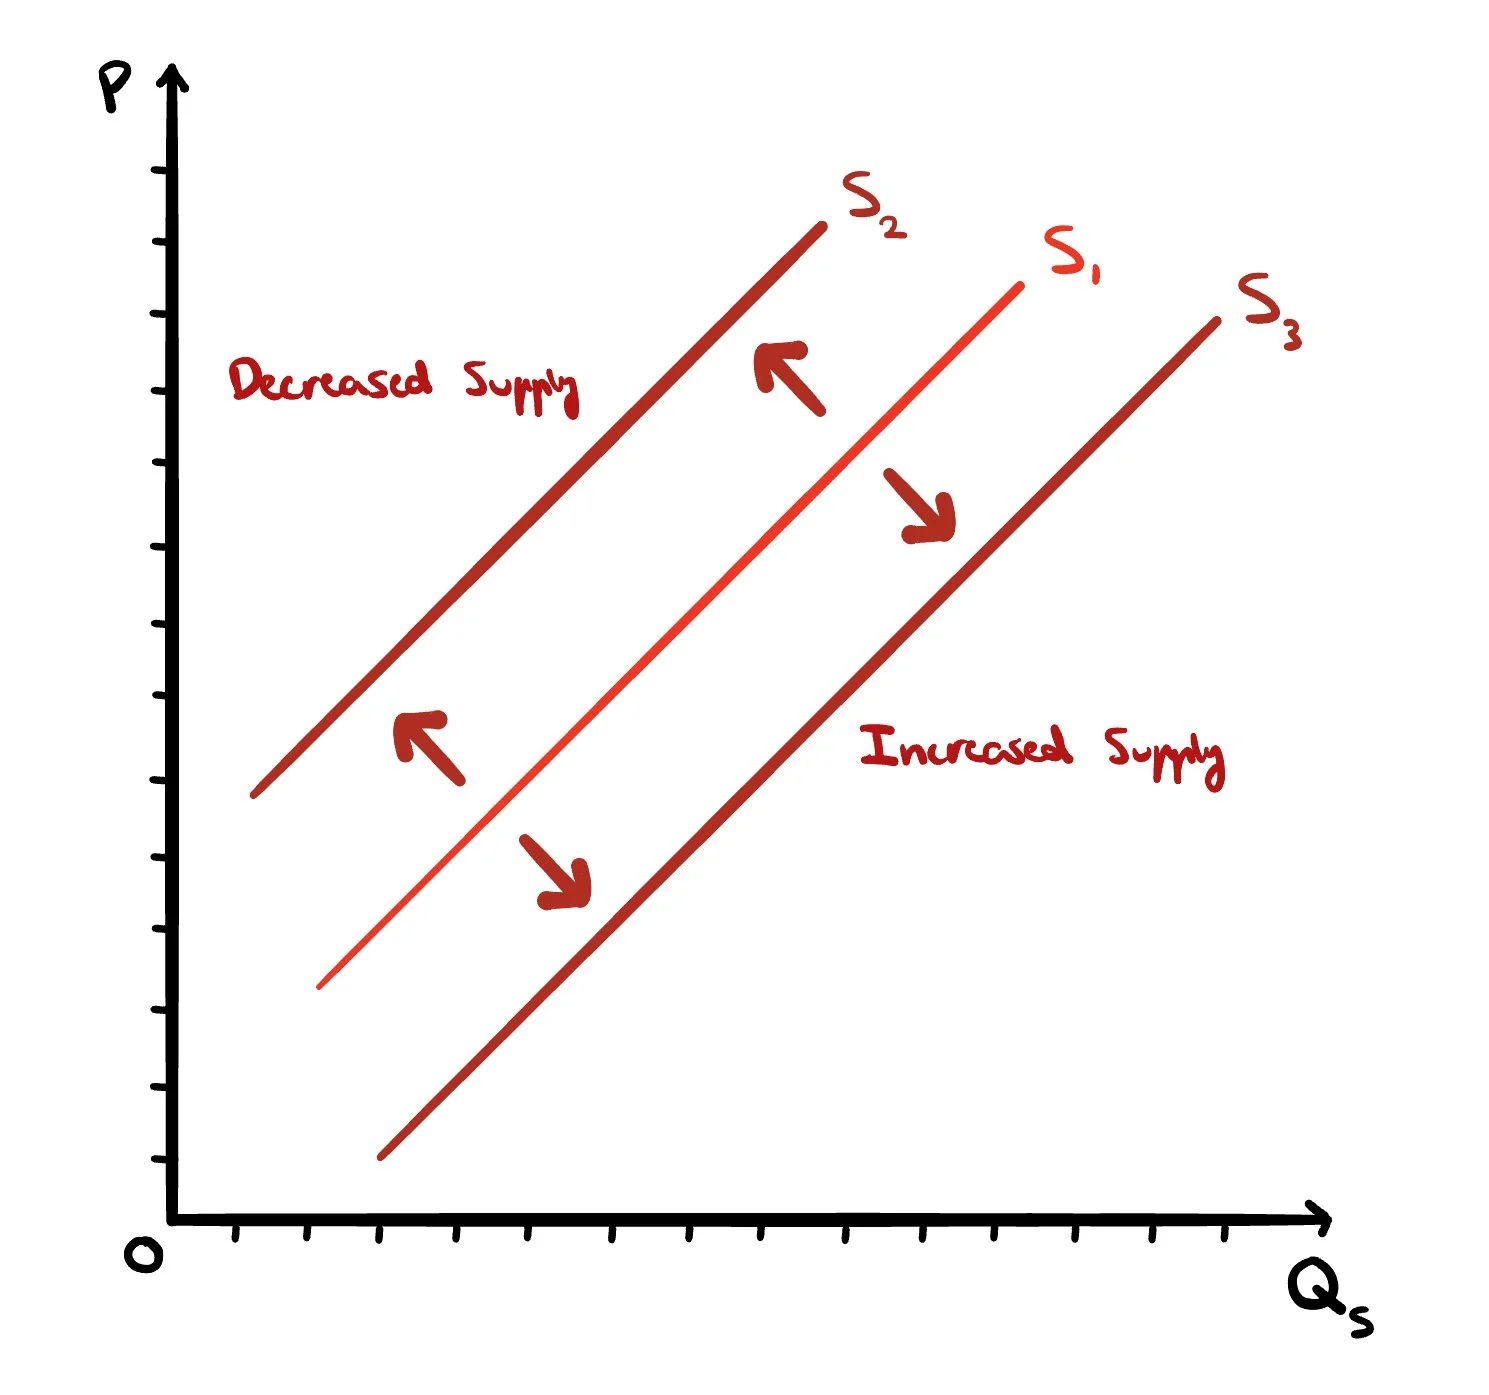
Figure 2. Supply Curve Shifting Both Ways
Where:
Segment Labeled “S₁” = Original Supply
Segment Labeled “S₂” = Decreased Supply
Segment Labeled “S₃” = Increased Supply
-
The graph above shows how the supply curve shifts when non-price factors influence production decisions. The original supply curve, S₁, can shift left to S₂ when supply decreases, often because rising input costs, stricter regulations, or adverse conditions make production more expensive or difficult, discouraging firms from producing as much at every price level. Conversely, S₁ can shift right to S₃ when supply increases, typically due to technological advancements, lower input prices, or favorable government policies like subsidies, which reduce production costs and make it more profitable to produce more. These shifts occur because producers respond not just to prices, but to changes in their production environment, and such changes affect the entire supply relationship rather than simply moving along a single curve.
Key points:
Axes: Price (vertical) vs. Quantity Supplied (horizontal)
S₁: Original supply curve
S₂: Shift left — higher costs or barriers reduce supply
S₃: Shift right — lower costs or incentives increase supply
Cause: Changes in non-price determinants, not the good’s own price

In Summary:
Movements along the supply curve and shifts in the curve are distinct yet interconnected concepts that shape market behavior. Movements, driven by price changes, reflect short-term adjustments along the existing curve. Shifts, caused by external factors, represent structural changes in supply conditions that create entirely new curves. By understanding these concepts, businesses, policymakers, and consumers can better navigate the complexities of evolving markets and respond effectively to both immediate and long-term changes.
Example:
The global transition to renewable energy highlights both types of supply changes. An outward shift in the supply curve for solar panels, driven by technological innovation, has reduced costs and increased adoption rates. Simultaneously, temporary price fluctuations in raw materials have caused movements along the supply curve as manufacturers adjust output.